
Dynamic Django Charts with Chart.js
Generating Dynamic Charts with Django, Chart.js, and HTMX
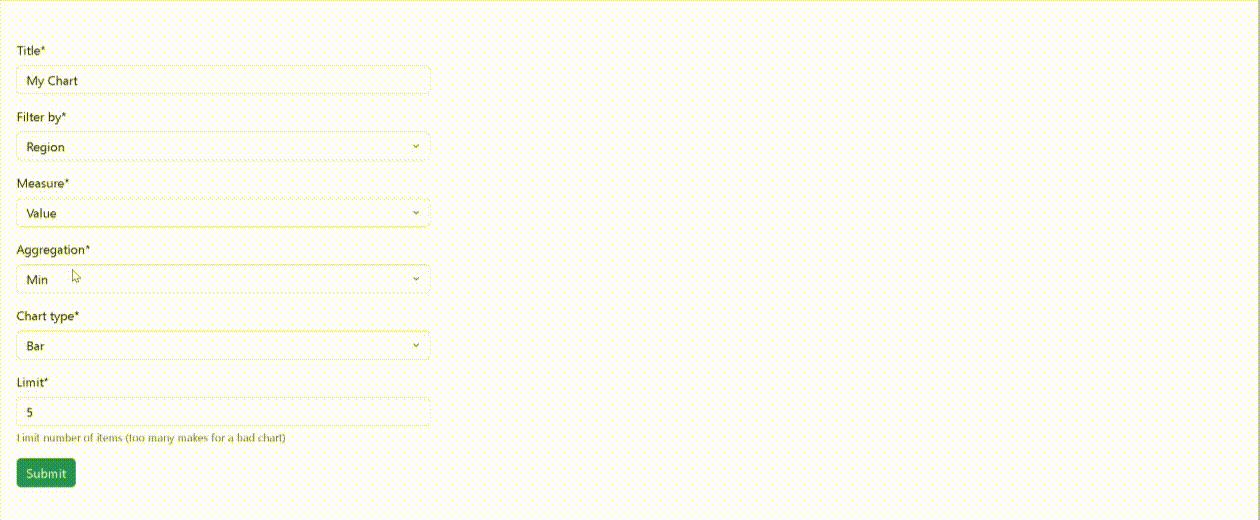
The goal: A form where the user selects the measure, aggregation, filters, and chart type, the form uses HTMX to perform AJAX and dynamically swap in the HTML (and JavaScript) for a chart.js chart which is rendered server-side in a normal Django template.
The form is generated by my generic DataService class, that can make the same type of form for any Django model.
Quick little demo:
I read this article from testdriven.io where the author Nik Tomazic shows us a class they used to generate the html and JS to generate a chart with chart.js.
I liked the article, and also used the code in a project and continued building on this foundation.
Nik's Chart class:
@dataclass
class Chart:
    """
    A class for using chart.js charts.
    `datasets` the data itself.
    this contains the data and some of the options for the data.
    For example, in a stacked bar chart the stack labels.
    `labels` the labels for the data
    ``chart_id`` is unique chart ID.A random id will be generated if none s provided.
    This needs to be a valid javascript variable name. Do not use '-'
    `palette` is a list of colors.The will generate if none are listed
    """
    chart_type: str
    datasets: List = field(default_factory=list)
    labels: List = field(default_factory=list)
    chart_id: str = field(default_factory=generate_chart_id)
    palette: List = field(default_factory=get_colors)
    options: dict = field(default_factory=get_options)
    title: str = 'Chart'
    legend: dict = field(default_factory=get_legend)
    xlabel: str = 'xlabel'
    ylabel: str = 'ylabel'
    description: str = None

    def from_lists(self, values, labels, stacks):
        """  function to build a chart from lists
        ``values`` is a list of datasets. If the chart is not stacked or grouped it will be a list containing one list of the values.For a stack it will be each stack as a different list in the values list.
        ``labels`` labels are the labels for the individual values
        ``stacks`` stacks are the labels for each datset in the values list. This will only contain one value if there are not stacks or groups of data."""
        self.datasets = []

        # make sure we have the right number of colors
        if len(self.palette) < len(values):
            get_random_colors(num=len(values), colors=self.palette)

        # build the datasets
        self.datasets.extend(
            {
                'label': stacks[i],  # stacks[i]
                'backgroundColor': self.palette[i],
                'data': values[i],

                'datalabels': {
                    'align': 'start',
                    'anchor': 'start'
                }

            }
            for i in range(len(stacks))
        )
        if len(values) == 1:
            self.datasets[0]['backgroundColor'] = self.palette

        self.labels = labels

    def from_df(self, df, values, labels, stacks=None, aggfunc=np.sum, round_values=0, fill_value=0):
        """
        function to build a chart from a dataframe
        ``df`` is the datframe to use
        ``values`` is the name of the values column
        ``stacks`` is the name of the stacks column
        ``labels`` is the name of the labels column
        ``aggfunc`` is the aggregate function to use to aggregate the values. Defaults to np.sum
        ``round_values``the decimal place to round values to
        ``fill_value`` is what to use for empty values"""

        pivot = pd.pivot_table(
            df,
            values=values,
            index=stacks,
            columns=labels,
            aggfunc=aggfunc,
            fill_value=0
        )

        pivot = pivot.round(round_values)

        values = pivot.values.tolist()
        labels = pivot.columns.tolist()
        stacks = pivot.index.tolist()

        self.from_lists(values, labels, stacks)

    def get_elements(self):
        """
        function to record all the chart elements by chart type this is the function to edit to add a new chart type
        """
        elements = {
            'data': {
                'labels': self.labels,
                'datasets': self.datasets
            },
            'options': self.options
        }

        if self.chart_type in ['bar', 'groupedBar']:
            elements['type'] = 'bar'
            self.options['scales'] = {

                'xAxes': [
                    {
                        'scaleLabel': {
                            'display': 'true',
                            'labelString': self.xlabel
                        },
                        'ticks': {
                            'beginAtZero': 'true',
                            'autoSkip': 'false'
                        }
                    }
                ],
                'yAxes': [
                    {
                        'scaleLabel': {
                            'display': 'true',
                            'labelString': self.ylabel
                        },
                        'ticks': {
                            'beginAtZero': 'true',
                            'autoSkip': 'false'
                        }
                    }
                ]
            }

        elif self.chart_type == 'doughnut':
            elements['type'] = 'doughnut'

        elif self.chart_type == 'horizontalBar':
            elements['type'] = 'horizontalBar'
            self.options['scales'] = {
                'scaleLabel': {
                    'display': 'true'
                },
                'xAxes': [
                    {
                        'scaleLabel': {
                            'display': 'true',
                            'labelString': self.xlabel
                        },
                        'ticks': {
                            'beginAtZero': 'true',
                            'autoSkip': 'false'
                        }
                    }
                ],
                'yAxes': [
                    {
                        'scaleLabel': {
                            'display': 'true',
                            'labelString': self.ylabel
                        },
                        'ticks': {
                            'beginAtZero': 'true',
                            'autoSkip': 'false'
                        }
                    }
                ]
            }

        elif self.chart_type == 'polarArea':
            elements['type'] = 'polarArea'

        elif self.chart_type == 'radar':
            elements['type'] = 'radar'

        elif self.chart_type == 'stackedBar':
            elements['type'] = 'bar'
            self.options['scales'] = {
                'scaleLabel': {
                    'display': 'true'
                },
                'xAxes': [

                    {'scaleLabel': {
                        'display': 'true',
                        'labelString': self.xlabel
                    }, 'stacked': 'true', 'ticks': {'autoSkip': 'false'}},

                ],
                'yAxes': [
                    {'scaleLabel': {
                        'display': 'true',
                        'labelString': self.ylabel
                    }, 'stacked': 'true', 'ticks': {'autoSkip': 'false'}}
                ]
            }

        elif self.chart_type == 'stackedHorizontalBar':
            elements['type'] = 'horizontalBar'
            self.options['scales'] = {
                'xAxes': [
                    {'scaleLabel': {
                        'display': 'true',
                        'labelString': self.xlabel
                    }, 'stacked': 'true', 'ticks': {'autoSkip': 'false'}}
                ],
                'yAxes': [
                    {'scaleLabel': {
                        'display': 'true',
                        'labelString': self.ylabel
                    }, 'stacked': 'true', 'ticks': {'autoSkip': 'false'}}
                ]
            }

        elements['legend'] = self.legend
        return elements

    def get_html(self):
        return f'<canvas id="{self.chart_id}"></canvas>'

    def get_js(self):
        return f"""var chartElement = document.getElementById('{self.chart_id}').getContext('2d');
var {self.chart_id}Chart = new Chart(chartElement, {self.get_elements()});"""

    def get_presentation(self, title: str):
        return {
            'html': self.get_html(),
            'js': self.get_js(),
            'title': title.upper()

        }
DataService class
The point of the class is to get the unique values for a field and do aggregations on that.
class DataService(ABC):
    """
    Generic class for generating queries, aggregations, and charts from django Model class instances """
    fields: List[str] = None
    aggregates: List[str] = None
    _populated: bool = False
    choices_getters: List[tuple] = None
    Filters: enum.Enum = None
    Measures: enum.Enum = None
    Aggregations: enum.Enum = None
So this is really the point of Python's MetaClasses and this is the perfect example of when to use them. But for now I'm just hacking this together this way...
Basically
DataService.__init__ snippet
def __init__():
  ...
  self.choices_to_generate = [
    ("Filters", self.fields),
    ("Measures", self.aggregates),
    ("Aggregations", ["Min", "Max", "Sum", "Count", "Avg"])
]

for item in self.choices_to_generate:
    setattr(self, item[0], generate_enum(item[1], name=item[0], choices=False))
    setattr(self, f"{item[0]}_text_choices", generate_enum(item[1], name=f"{item[0].capitalize()}Choices"))
Fun with Enum (and Django's <Text|Char|Integer>Choices)
AggregationTypes = enum.Enum('AggregationTypes', {'Avg': Avg, 'Sum': Sum, 'Min': Min, 'Max': Max})

ChartTypes = enum.Enum('ChartTypes', ["bar", "doughnut", "stackedHorizontalBar", "stackedBar", "polarArea", "radar", "groupedBar"])

ChartChoices = TextChoices('ChartChoices',["bar", "doughnut", "stackedHorizontalBar", "stackedBar", "polarArea", "radar","groupedBar"])


def aggregation_type_from_str(s):
    if hasattr(AggregationTypes, s):
        return getattr(AggregationTypes, s).value


def generate_enum(list_or_dict: Union[List, dict], choices=True, name="Choices"):
    cls = enum.Enum
    if choices:
        cls = TextChoices
    return cls(name, list_or_dict)
DataService calculation method
def calculation(self, what: str, value: str, aggregation: str):
    """
    what [filter option] has the [aggregation option] of [measure option]
    eg:  what `product.color` has the highest `aggregation.Sum` of `product.sale_count`
    :param what: str [filter option]
    :param value: str [measure option]
    :param aggregation: str [aggregation option]
    :return:
    """
    field = what
    uniques = getattr(self, self.get_set_name(field))
    results = []
    for unique_value in uniques:
        x = {field: unique_value}
        q = {f'{field}__icontains': unique_value}
        x['count'] = self.get_from_count(field, unique_value)
        result_key = value + f'__{aggregation.lower()}'
        aggregation_func = aggregation_type_from_str(aggregation)
                        x.update(self.model_class.objects.filter(**q).aggregate(aggregation_func(value)))

        if not x[result_key]:
            pass
        else:
            # print(x)
            results.append(x)
    return sorted(results, key=lambda d: d[result_key], reverse=True)
More fun with Enum and the last few snippets
DataService
def get_chart_form(self, *args, **kwargs):
    filter_choices = getattr(self, "filter_text_choices")
    measure_choices = getattr(self, "measure_text_choices")
    aggregation_choices = getattr(self, "aggregation_text_choices")

    class ChartForm(forms.Form):
        title = forms.CharField(max_length=200, widget=forms.TextInput(), initial="My Chart")
        filter_by = forms.ChoiceField(choices=filter_choices.choices)
        measure = forms.ChoiceField(choices=measure_choices.choices)
        aggregation = forms.ChoiceField(choices=aggregation_choices.choices, required=True)
        chart_type = forms.ChoiceField(choices=ChartChoices.choices)

        limit = forms.IntegerField(
            required=True, min_value=1, max_value=100,
            help_text="Limit number of items (too many makes for a bad chart)",
            widget=forms.NumberInput(), initial=5)

    return ChartForm(*args, **kwargs)

def get_chart_data(self, chart_form: forms.Form):
    if not chart_form.is_valid():
        return chart_form.errors
    data = chart_form.cleaned_data
    return self.calculation(data['filter_by'], data['measure'], data['aggregation'])

def get_chart_description(self, chart_form: forms.Form):
    data = chart_form.cleaned_data
    return f"""<strong>{self.model_class.__name__}</strong> models,
    filtered by their <em>{data['filter_by']}</em> attribute,
    with the <em>{data['aggregation']}</em>
    of the measure <em>{data['measure']}</em>. <br> <small><strong>Chart type:</strong> {data['chart_type']} </small>"""

def make_chart(self, chart_form: forms.Form, title=None):
    if not title:
        title = f"{self.__class__} Generated Chart"    data = self.get_chart_data(chart_form)
    top = data[:chart_form.cleaned_data['limit']]
    int_cols = f"{chart_form.cleaned_data['measure']}__{chart_form.cleaned_data['aggregation'].lower()}"
    chart_id = f"{chart_form.cleaned_data['chart_type']}_chart_1"
    df = objects_to_df(top, fields=data[0].keys(), is_values=True, int_cols=[int_cols], )
    chart_obj = Chart(chart_form.cleaned_data['chart_type'], chart_id=chart_id, palette=PALETTE)
    chart_obj.from_df(df, values=int_cols, labels=[chart_form.cleaned_data['filter_by']])

    return chart_obj.get_presentation(title=chart_form.cleaned_data['title'])
Now we've done it. Now we can inherit from these classes with any model.
class ProductData(DataService):
   cleaner_class = ProductCleaner
    fields = [
        'material',
        'category'
    ]
    aggregates = ['cost', 'sales_count']
And we have a view that shows a form and generates a dynamic chart based on the inputs
def make_chart(request):
    p = ProductData()
    if request.method == 'POST':
        form = p.get_chart_form(request.POST)
        if form.is_valid():
            chart = p.make_chart(form, title="Hello world")
            desc = p.get_chart_description(form)
            chart['description'] = desc
            charts = [chart]
            context = {'charts': charts, 'stats': stats}
            return render(request, 'core/chart_partial.html', context)
    else:
        form = p.get_chart_form()
    return render(request, 'core/chart_form.html', {
        'form': form
    })
The templates
chart_form.html
{% extends 'base.html' %}
{% load crispy_forms_tags %}

{% block content %}
    <div class="m-4">
        <div class="row mb-4 mt-4 no-gutters">
            <div class="col-md-4">
                <form hx-post="" hx-target="#swap-me" hx-swap="innerHTML"
                      hx-indicator="#indicator">
                    {% csrf_token %}
                    {{ form|crispy }}
                    <input type="submit" value="Submit" class="btn btn-success">
                </form>
            </div>
            <div class="col-md-8">
                <!-- loading indicator -->
                <svg id="indicator" class="d-flex mx-auto htmx-indicator fa-spin" xmlns="http://www.w3.org/2000/svg" width="6em" height="6em" viewBox="0 0 1664 1728"><path fill="currentColor" d=""></path></svg>

                <div id="swap-me"
                style="position: absolute; top:0; width:100%;"></div>
                </div>
            </div>
    </div>
    {% endblock %}

{% block js_scripts %}
    <script src="https://unpkg.com/htmx.org@1.9.2"></script>
    <script src="https://cdn.jsdelivr.net/npm/chart.js@2.9.3"></script>
    <script src="/static/chartjs-plugin-datalabels.min.js"></script>
{% endblock %}>
chart_partial.html
{% for chart in charts %}
    <div class="card">
        <div class="mat-card-header text-center card-title">
            <h4 class="lead p-4 m-2">{{ chart.title }}</h4>
        </div>        {% if chart.description %}
            <p class="mx-auto card-text pl-4 pr-4 pt-0 pb-0 mt-0 mb-0">
            {{ chart.description|safe }}
            </p>
        {% endif %}
        <div class="card-body">
            <div class="chart-container" style="height:100%; width:100%;">
                {{ chart.html|safe }}
            </div>
        </div>
    </div>
    <script>
    {{ chart.js|safe }}
    </script>
{% endfor %}
The DataService class is a generic class designed for generating queries, aggregations, and charts from Django model class instances. It provides a flexible and reusable approach for data manipulation and visualization.
Here's a breakdown of what the DataService class does:
- The class definition indicates that it is an abstract base class (
ABC) which suggests that it serves as a foundation for deriving specific data service implementations. - The class has various attributes such as
cleaner_class,fields,aggregates,_populated,choices_getters,Filters,Measures, andAggregationsthat are used throughout its methods. - The constructor (
__init__) initializes theDataServiceobject by setting up the necessary attributes based on the provided arguments. It creates an instance of thecleaner_classand extracts the model class from it. It also populates thefieldsandaggregatesif provided, otherwise, it uses the default values. Additionally, it sets up the unique values for the fields by calling theset_unique_valuesmethod. - The
get_chart_formmethod generates a form object (ChartForm) used for capturing user input for generating a chart. It sets up fields such as title, filterby, measure, aggregation, charttype, and limit. The form is returned to be rendered in the user interface. - The
get_chart_datamethod takes a validchart_formand retrieves the cleaned data from the form. It then calls thecalculationmethod with the appropriate parameters to perform the actual data calculation based on the user's input. - The
get_chart_descriptionmethod generates a description of the chart based on the user's input from thechart_form. It incorporates the model class, filter attribute, aggregation, measure, and chart type. - The
make_chartmethod generates a chart based on the providedchart_form. It retrieves the necessary data using theget_chart_datamethod, selects the top entries based on the limit, creates a DataFrame, and utilizes aChartobject to generate the chart presentation. The resulting chart is returned. - The
set_unique_valuesmethod populates the unique values for each field specified infields. It uses thecleanerinstance to fetch the unique values for the corresponding fields in the model class. - The
get_unique_valuesmethod retrieves the unique values for a given field. It first ensures that the unique values have been populated by callingset_unique_valuesif necessary and then returns the values for the specified field. - The
get_from_countmethod calculates the count of instances in the model class that match a specific field-value pair. - The
calculationmethod performs the main data calculation based on the user's selections. It iterates over the unique values of the selected filter option, applies the selected aggregation function to the chosen measure option, retrieves the count of instances for each unique value, and aggregates the data accordingly. The results are sorted based on the aggregation value in descending order and returned.
Overall, the DataService class provides a framework for generating dynamic charts based on user input and model data. It encapsulates common data manipulation operations and facilitates the creation of insightful visualizations from Django model instances.
Certainly! Here's an example of inheriting from the DataService class and using it to generate charts for a Product model:
from django.db import models
from django import forms
from myapp.utils import DataService

class Product(models.Model):
    name = models.CharField(max_length=100)
    price = models.DecimalField(max_digits=8, decimal_places=2)
    category = models.CharField(max_length=50)

    # Other fields and methods for the Product model

class ProductDataService(DataService):
    cleaner_class = ProductCleaner  # Assuming you have a ProductCleaner class defined

    Filters = enum.Enum('Filters', [('category', 'Category'), ('price', 'Price Range')])
    Measures = enum.Enum('Measures', [('price', 'Price')])
    Aggregations = enum.Enum('Aggregations', [('min', 'Minimum'), ('max', 'Maximum'), ('avg', 'Average')])

    def __init__(self, *args, **kwargs):
        super().__init__(*args, **kwargs)
        self.aggregates = [aggregation.value for aggregation in self.Aggregations]

    def calculation(self, what: str, value: str, aggregation: str):
        # Customize the calculation logic for ProductDataService
        # You can access the Product model using self.model_class
        # Perform the necessary filtering, aggregation, and calculations on the Product instances
        # Return the results in the desired format

# Example usage:
product_data_service = ProductDataService(fields=['category', 'price'])
chart_form = product_data_service.get_chart_form()
# Render the chart_form in the UI and capture user input

if chart_form.is_valid():
    chart_description = product_data_service.get_chart_description(chart_form)
    chart = product_data_service.make_chart(chart_form)
    # Display the chart and its description to the user
else:
    errors = chart_form.errors
    # Handle form validation errors
In this example, we have defined a Product model with fields such as name, price, and category. We then create a ProductDataService class that inherits from the DataService class. The ProductDataService overrides the necessary methods to customize the behavior for the Product model.
In the ProductDataService class, we specify the cleaner_class as ProductCleaner, assuming you have defined a ProductCleaner class that provides cleaning and filtering functionality specific to the Product model.
We also define the Filters, Measures, and Aggregations enumerations to specify the available options for filtering, measuring, and aggregating data.
In the calculation method of ProductDataService, you can implement the specific logic to filter, aggregate, and calculate data based on the selected filter, measure, and aggregation options. Accessing the Product model can be done using self.model_class, and you can use standard Django ORM querying and aggregation methods to perform the required operations.
To use the ProductDataService, you would create an instance of it and customize it as needed. You can set the fields attribute to specify the fields to consider for chart generation. Then, you can use the provided get_chart_form method to obtain a form object for capturing user input. After validating the form, you can generate the chart and its description using the make_chart and get_chart_description methods, respectively.
Please note that this example assumes you have defined the necessary dependencies, such as ProductCleaner, and have integrated it with your Django application. Adjustments may be needed based on your specific project structure and requirements.
There are several ways you can improve the DataService class to enhance its functionality and maintainability. Here are a few suggestions:
Separation of Concerns: The
DataServiceclass currently handles data cleaning, filtering, aggregation, form generation, and chart creation. Consider separating these responsibilities into separate classes or methods to improve code organization and maintainability. For example, you can create a separate class for data cleaning and filtering, another class for data aggregation, and so on.Modularization: Break down the large
DataServiceclass into smaller, more focused classes or functions. Each class or function should have a single responsibility and be easily testable and reusable.Encapsulate Data: Consider encapsulating the data manipulation logic within the class by implementing private methods or properties. This helps in encapsulating internal implementation details and exposes only the necessary public methods or properties.
Configuration Flexibility: Allow more flexibility in configuring the
DataServiceclass. For example, instead of hard-coding the field names and aggregation options, provide parameters or configuration options that allow users to define their own fields and aggregations dynamically.Documentation: Enhance the documentation of the class, methods, and parameters. Clear and comprehensive documentation helps other developers understand the purpose and usage of the class and its methods. It can also serve as a reference for future maintenance.
Error Handling: Implement proper error handling and validation. Add appropriate error handling mechanisms, such as exception handling or returning error messages, to provide informative feedback when unexpected conditions or errors occur.
Unit Testing: Write unit tests for the
DataServiceclass and its methods. Unit tests help ensure that the class functions as intended and can catch bugs or regressions during development or future modifications.Code Reusability: Aim for code reusability by designing the
DataServiceclass to be applicable to multiple models, rather than being tightly coupled to a specific model. This can be achieved by making the class more generic and configurable.Performance Optimization: If you anticipate working with large datasets, consider optimizing the code for performance. Use appropriate Django query optimization techniques, such as selecting specific fields, prefetching related data, or using database indexes, to improve query performance.
User Interface Enhancement: Improve the user interface aspects of the class, such as providing more intuitive chart options, customizable chart visualizations, and interactive features for exploring the data.
Remember, these are just suggestions, and the specific improvements you make to the DataService class should be based on your project's requirements, constraints, and development practices.
Title: Simplify Your Data Analysis with the DataService Class
Introduction: In today's data-driven world, extracting meaningful insights from complex datasets is crucial for informed decision-making. However, handling data processing, filtering, aggregation, and chart generation can be a daunting task for developers. That's where the DataService class comes to the rescue. In this blog post, we'll explore how the DataService class simplifies data analysis and visualization in Python using the Django framework.
What is the DataService Class? The DataService class is a powerful tool designed to generate queries, aggregations, and charts from Django Model class instances. It provides a generic approach to handle data cleaning, filtering, and aggregation, making it easier to analyze and visualize your data.
How Does it Work? At its core, the DataService class leverages the functionalities of Django's Model class and integrates with popular charting libraries like Chart.js. It encapsulates various data manipulation operations and offers a set of methods to generate charts based on the provided data.
Key Features and Benefits:
Simplified Data Analysis: With the DataService class, you can focus on analyzing your data rather than worrying about the underlying data processing and aggregation. It automates common data operations, saving you valuable time and effort.
Customizable Chart Generation: The class provides a straightforward way to generate interactive charts based on your data. You can easily configure chart options, such as chart type, title, filters, measures, and aggregations, to create compelling visualizations.
Flexibility and Reusability: The class is designed to be flexible and reusable. It can be easily extended and customized to fit your specific data analysis needs. Additionally, it promotes code reusability by separating concerns and encapsulating data manipulation logic.
Integration with Django: The DataService class seamlessly integrates with Django, leveraging its powerful ORM capabilities. It simplifies data retrieval, filtering, and aggregation by utilizing Django's query expressions and aggregation functions.
User-Friendly Interface: The class offers a user-friendly interface through a chart form, where users can select desired filters, measures, and aggregations. The generated charts provide meaningful insights into the data, enabling better understanding and decision-making.
Conclusion: The DataService class empowers developers to streamline their data analysis workflows. By abstracting complex data processing and chart generation tasks, it allows developers to focus on extracting insights and visualizing data effectively. Whether you're working on a small project or dealing with large datasets, the DataService class simplifies the process and enhances your productivity. Give it a try and unlock the potential of your data analysis endeavors.
Remember, the DataService class is just a starting point, and you can further customize and enhance it based on your specific requirements. Happy data analyzing!
The code uses dynamically generated Enums to provide a convenient and flexible way of handling choices for filters, measures, and aggregations in the DataService class. Here's why dynamically generated Enums are beneficial:
Simplified Choice Management: Enums offer a structured approach to manage and represent a set of predefined choices. By dynamically generating Enums based on the available fields and aggregates, the code avoids the need for manually defining and updating static choice lists.
Dynamic Generation of Choices: The use of dynamically generated Enums allows the DataService class to adapt to different data models without requiring modifications to the code. As the class initializes, it automatically generates Enums based on the available fields and aggregates, reflecting the current state of the data model.
Improved Maintainability: The dynamically generated Enums promote code maintainability by reducing the effort required to update choices when the data model changes. Instead of manually modifying the code, the Enums dynamically adjust based on the current fields and aggregates, ensuring that the choices remain up to date.
Enhanced Flexibility: With dynamically generated Enums, developers can easily extend the DataService class to handle additional fields and aggregates without modifying the class itself. This flexibility allows for seamless integration with different data models and promotes code reuse.
Improved User Experience: The dynamically generated Enums contribute to a more user-friendly interface when generating charts. Users can select filters, measures, and aggregations from a predefined list of choices, making it easier to interact with the DataService class and generate meaningful visualizations.
In summary, the use of dynamically generated Enums in the code enhances flexibility, maintainability, and the overall user experience of the DataService class. It simplifies choice management, adapts to different data models, and promotes code reuse, making it a valuable feature for data analysis and visualization tasks.
.png)
About Reed Jones
I'm a freelance developer based out of Oakland
California.
Read more about me here.